14th Jun 2023
Understanding the Basics: How Chart Recorders Work
Chart recorders have long been a staple in various industries for monitoring and recording critical data. Check out our helpful guide on understanding the basics of chart recorders, how they work, and other essential information worth considering when purchasing a device for your specific application.
Basic Functions
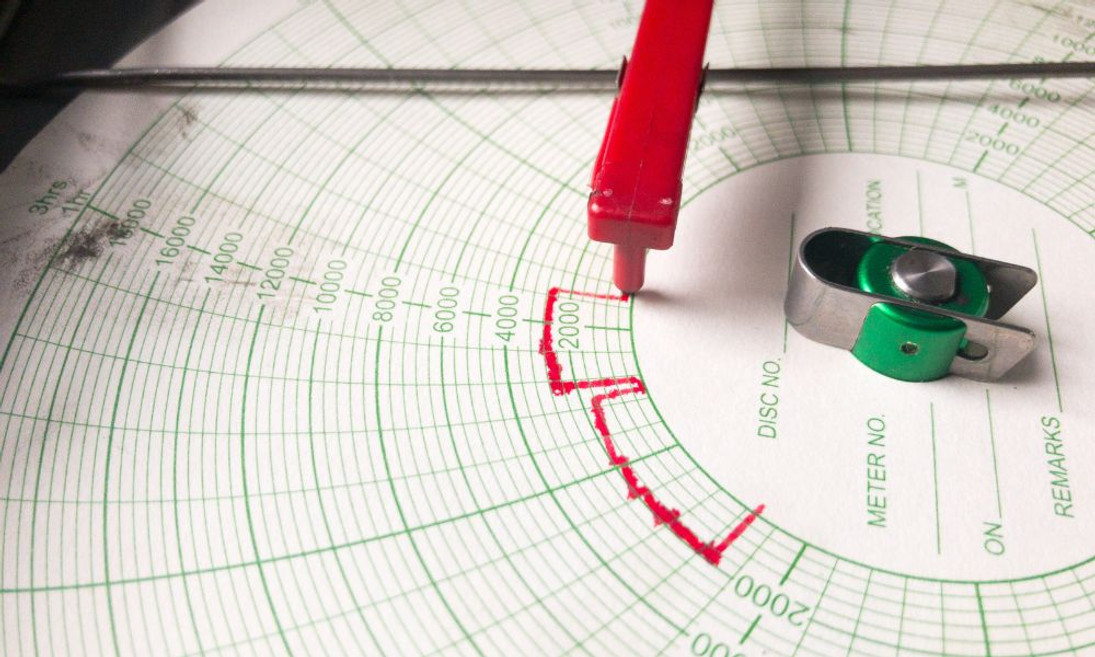
Chart recorders are essential instruments used to monitor and record various physical or electrical parameters over time. These devices provide a continuous, real-time graphical representation of the data being measured, making it easier for users to observe trends, patterns, and potential anomalies. The recorded data is typically displayed on a circular or strip chart, with the x-axis representing time and the y-axis displaying the parameter being measured.
The fundamental operation of a traditional chart recorder involves a sensing element, which detects the changes in the parameter being monitored, and a mechanical recording component. The sensing element, such as a thermocouple or pressure sensor, generates an electrical signal proportional to the change in the measured parameter. This signal is then processed and amplified before it drives a pen or stylus that physically records the data onto the chart paper. As the paper moves through the recorder, the pen traces an accurate representation of the variations in the parameter, allowing users to analyze the data easily.
Differences in Measurement Parameters
Chart recorders are versatile instruments that measure humidity, temperature, pressure, voltage, and more. Each of these measurements requires a specific type of sensor or input device to accurately detect and convert the changes in the parameter into an electrical signal that can be recorded. For instance, a thermocouple is used for temperature measurement, a capacitive or resistive sensor for humidity, a strain gauge or piezoelectric transducer for pressure, and a voltage divider or shunt resistor for voltage.
The unique characteristics of each sensor or input device influence how the chart recorder processes and records the data. For example, thermocouples generate a small voltage proportional to the temperature difference between their two junctions, while capacitive humidity sensors produce a change in capacitance as the humidity level varies. These differences in signal types require tailored signal conditioning circuits within the chart recorder to ensure accurate and reliable data recording.
Application Considerations
Different applications may demand varying levels of precision and sensitivity, which will dictate your choice of sensing elements and recording mechanisms. For example, monitoring temperature fluctuations in a laboratory setting might necessitate a highly sensitive and accurate thermocouple. In contrast, measuring pressure changes in an industrial application may require a more robust and durable sensor like a piezoelectric transducer.
Environmental factors, such as temperature, humidity, and vibration, can also impact the performance of a chart recorder. Choosing a recorder designed to withstand the specific conditions of the intended application is essential. Additionally, the selection of chart paper and pen or stylus should be compatible with the environment to ensure that the recorded data remains legible and accurate over time. In some cases, it may be necessary to invest in additional protective measures, such as enclosures or insulation, to maintain the reliability and longevity of the chart recorder.
Understanding the basic functions, measurement parameters, and application considerations of traditional chart recorders is essential for making informed decisions when selecting your device. Now that you fully understand how chart recorders work, it’s time to order one for your application! Check out our array of quality chart recorder supplies and products, including our selection of industry-leading Honeywell circular chart paper, here at Recorders Charts & Pens.

