12th Jun 2023
How To Interpret the Data From Your Chart Recorder
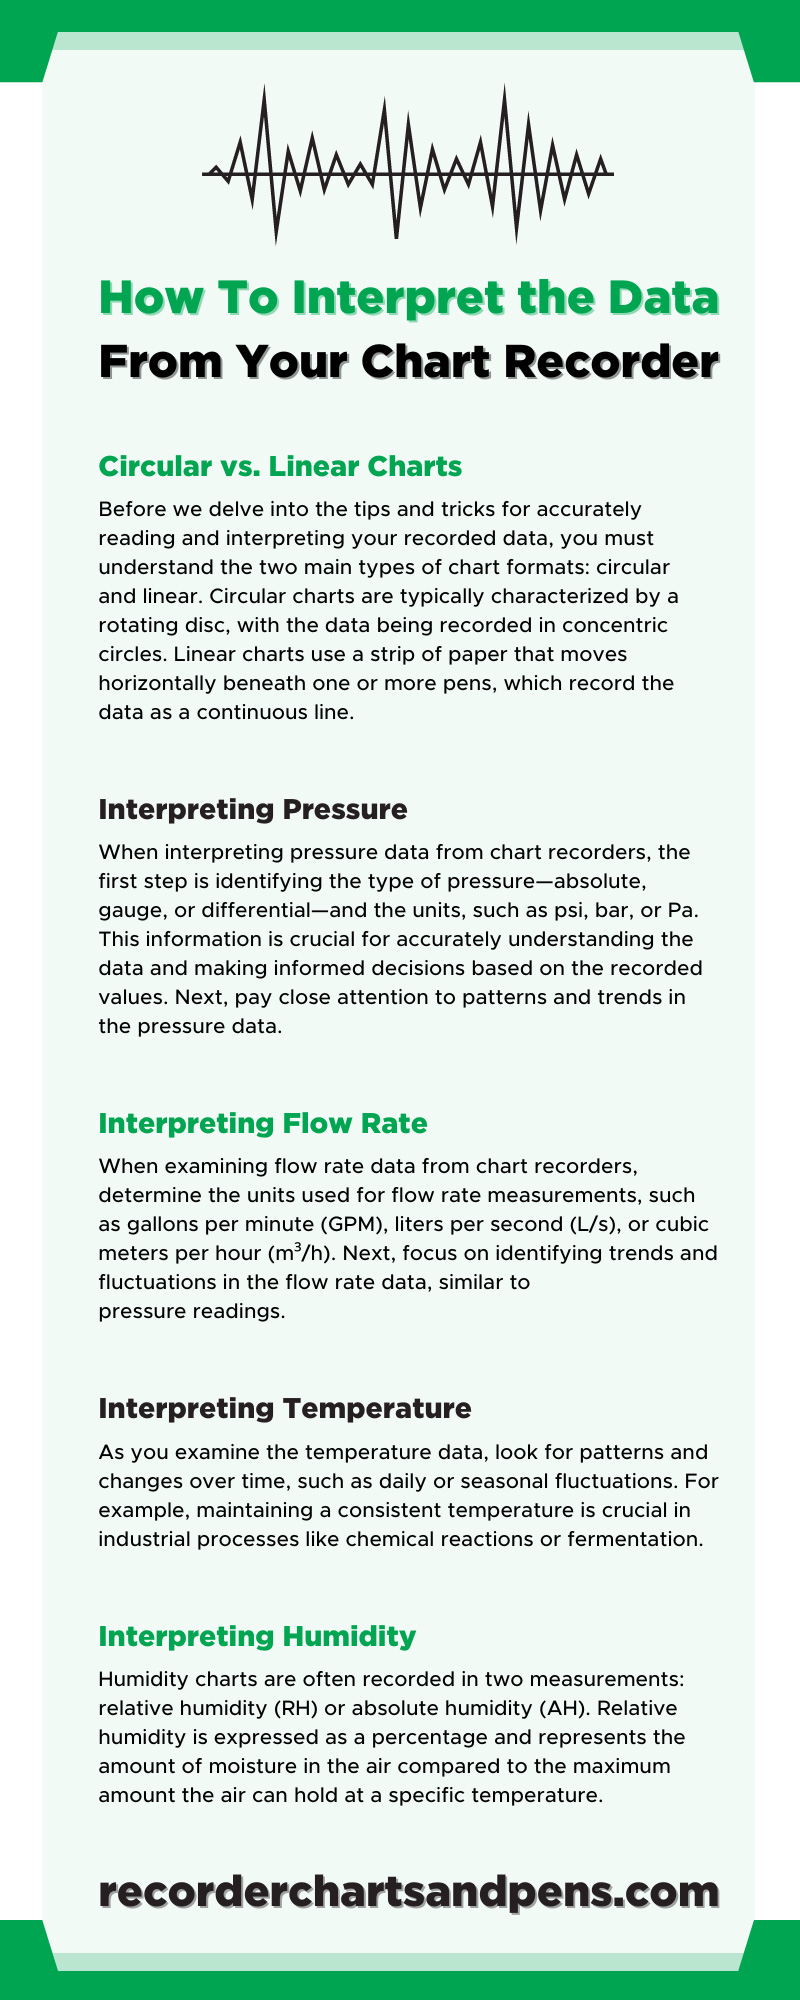
Chart recorders are essential tools for professionals across various industries, as they provide valuable insights into the performance and efficiency of systems. This definitive guide will help you understand how to interpret data from your chart recorder, whether you’re measuring pressure, flow rate, temperature, humidity, or voltage.
Circular vs. Linear Charts
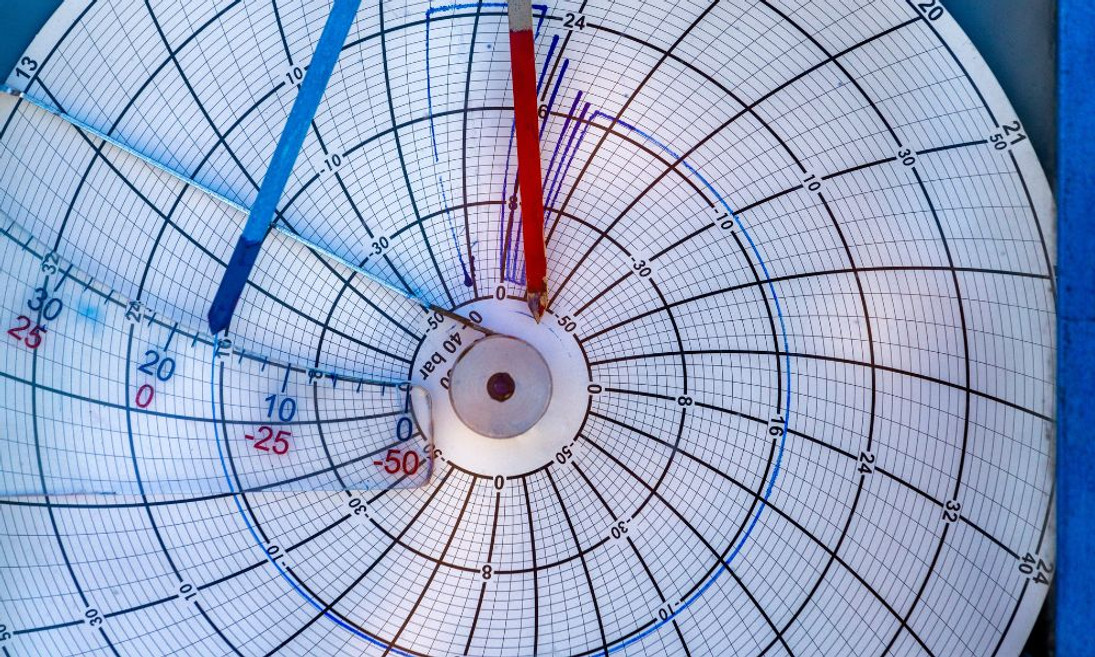
Before we delve into the tips and tricks for accurately reading and interpreting your recorded data, you must understand the two main types of chart formats: circular and linear. Circular charts are typically characterized by a rotating disc, with the data being recorded in concentric circles. The rotation period can vary from a few hours to several days, depending on the application's requirements. One advantage of circular charts is their compact size, which allows for easy storage and archiving. Additionally, they provide a continuous overview of the recorded data, making it simple to identify patterns or trends over the entire recording period.
Linear charts use a strip of paper that moves horizontally beneath one or more pens, which record the data as a continuous line. These charts can cover various time scales, from minutes to months, and present data in a familiar, graph-like format. Linear charts make it easy to compare data points directly, as they are plotted along a uniform time scale. This format is particularly useful when comparing data or examining multiple variables simultaneously.
The choice between circular and linear chart formats depends on the application, user preferences, and the desired level of detail in data analysis. Understanding the key distinctions between these two formats allows you to select the most suitable meter charts for your needs and ensure accurate data interpretation.
Interpreting Pressure
When interpreting pressure data from chart recorders, the first step is identifying the type of pressure—absolute, gauge, or differential—and the units, such as psi, bar, or Pa. This information is crucial for accurately understanding the data and making informed decisions based on the recorded values. Next, pay close attention to patterns and trends in the pressure data. Observe whether the pressure remains stable over time or if it fluctuates. Sudden spikes or drops in pressure could indicate system malfunctions, leaks, or blockages that require further investigation.
If you notice anything unusual in the pressure readings, it's essential to identify the cause and take corrective actions to maintain system performance and safety. Lastly, compare pressure readings with other parameters, such as flow rate and temperature. Identifying correlations between pressure and other variables can provide a more comprehensive understanding of the system's performance and potential issues. For example, an increase in pressure accompanied by a decrease in flow rate might suggest a blockage in the system. By analyzing pressure data in conjunction with other variables, you can diagnose problems and optimize your system's efficiency.
Interpreting Flow Rate
When examining flow rate data from chart recorders, determine the units used for flow rate measurements, such as gallons per minute (GPM), liters per second (L/s), or cubic meters per hour (m³/h). Next, focus on identifying trends and fluctuations in the flow rate data, similar to pressure readings. Consistent flow rates generally indicate a well-functioning system, while sudden changes or irregular patterns may signal essential data readings. By closely monitoring the flow rate data, you can quickly react to potential problems and take corrective actions to maintain your system’s efficiency.
Finally, evaluate the efficiency of your system by comparing the recorded flow rate to the ideal or expected flow rate for your application. This comparison can help you identify areas of improvement, such as optimizing pump performance, adjusting valve settings, or addressing blockages or leaks. Continuously monitoring and evaluating your flow rate data will enable you to maintain optimal system performance and minimize the risk of costly downtime or damage.
Interpreting Temperature
When reading charts, it's essential to identify the temperature scale and the application's ideal operating temperature range. Determine whether the temperature is recorded in Celsius (°C), Fahrenheit (°F), or Kelvin (K), and establish the expected temperature range for your system or process. This foundation ensures superior accuracy and better readings overall.
As you examine the temperature data, look for patterns and changes over time, such as daily or seasonal fluctuations. For example, maintaining a consistent temperature is crucial in industrial processes like chemical reactions or fermentation. If the temperature deviates from the desired range, it could impact the reaction rate, resulting in reduced yield or altered product properties. Furthermore, investigate the relationship between temperature and other variables to understand system performance. For example, a sudden increase in temperature alongside a pressure drop may indicate leaking or cooling complications.
Consider outside factors when reading your temperature data, as they can impact the accuracy of your results. Ambient temperature, equipment heat generation, or insulation elements all hinder the performance of your monitoring tools. If you notice these factors influence your system's temperature, you may need to minimize their effect, such as improving insulation, adjusting the heating or cooling systems, or scheduling maintenance during periods of low ambient temperatures.
Interpreting Humidity
Humidity charts are often recorded in two measurements: relative humidity (RH) or absolute humidity (AH). Relative humidity is expressed as a percentage and represents the amount of moisture in the air compared to the maximum amount the air can hold at a specific temperature. Absolute humidity is the actual mass of water vapor in a given volume of air and is typically measured in grams per cubic meter (g/m³). Maintaining consistent humidity levels is essential for optimal performance and product quality in manufacturing, agriculture, or indoor air quality monitoring.
Deviations from the desired humidity range can lead to issues like condensation, mold growth, or material degradation. By closely monitoring humidity data and identifying sudden changes or abnormal patterns, you can take corrective actions to maintain the appropriate humidity levels and ensure the stability and efficiency of your system or process.
Understanding the nuances of chart recorders and their data representation is essential for making well-informed decisions in various applications. Follow this guide on interpreting the data from your chart recorder to optimize your processes. Contact our friendly team at Recorders Charts & Pens today for additional interpretation resources and helpful recording supplies.


